Why Choose a Pick and Place Machine for Your Business?
A pick-and-place machine can change the pace and consistency of a production line. It positions components with repeatable accuracy, helping teams manage demanding assembly work. For electronics manufacturers, that may mean placing tiny parts onto circuit boards while reducing repetitive manual handling. The practical benefit is clear. Yet the right machine depends on your products, throughput, component range, and available floor space.
Before investing, examine real production needs. Compare placement speed with accuracy, feeder capacity, changeover time, software, and service support. Ask suppliers to demonstrate your actual components, not just an ideal sample. Watch how the machine handles a small part, a board change, and a production interruption. Those details matter. A fast specification sheet cannot show every daily inconvenience.
Manufacturing entrepreneur Elon Musk once said, “The machine that builds the machine is vastly more important than the machine itself.” He made this remark about production systems, not specifically about pick-and-place equipment. Still, it highlights why the process around a Place Machine deserves careful attention. Staff training, programming, maintenance, and upstream material flow all affect results. Automation is not a cure-all. A machine may expose weaknesses in planning that were easy to overlook by hand. That is worth considering before purchase. Choose equipment that fits the work you have now, while leaving sensible room for future product changes. Compare total operating costs, request references, and verify support response times. Then judge the investment by stable output and reduced bottlenecks, not speed alone.
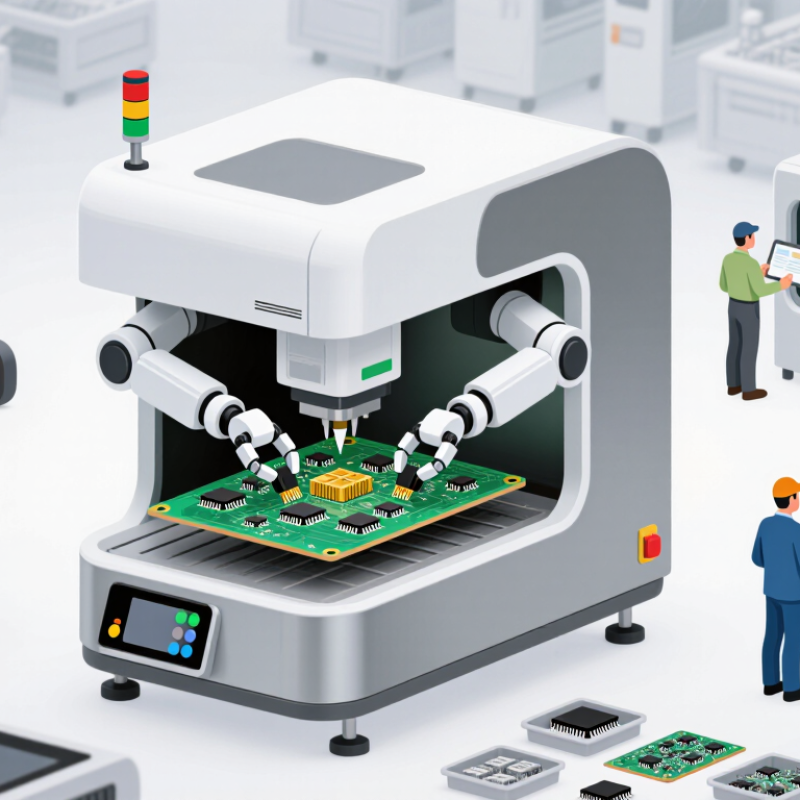
SMT Pick-and-Place Machines: The IPC-9850 Equipment Performance Framework
Why Choose a Pick and Place Machine for Your Business?
SMT Pick-and-Place Machines: The IPC-9850 Equipment Performance Framework
A machine’s headline placement rate can look impressive on a sales sheet. Yet production performance depends on how that rate is measured. The IPC-9850 framework offers a structured way to characterize surface-mount placement equipment under defined test conditions. It helps buyers compare machine capability using more than a single advertised speed.
That matters on the factory floor. A placement line may handle tiny components, fine-pitch parts, and boards with different layouts. Placement accuracy and operating speed both affect output, but neither tells the whole story alone. A standardized evaluation can make equipment comparisons more meaningful. It can also help teams ask suppliers clearer questions about test setup and reported results.
Still, a benchmark is not a promise. Real output changes with feeder setup, component mix, board design, and changeover time. A machine tested with a specific arrangement may perform differently in your plant. That gap is easy to overlook. Review the test conditions, then compare them with your own production needs. Even a careful framework cannot replace a trial using representative boards and components. Some details only become clear after the line runs.
Throughput Benchmarks: Yamaha YRM20R’s Rated Maximum of 115,000 CPH
A rated maximum of 115,000 components per hour signals serious placement speed. For a business, this benchmark can help compare equipment and estimate line capacity. But rated CPH is a peak figure, not a promise of everyday output. Actual results depend on board design, component size, feeder setup, placement accuracy, and how often the line pauses. A board with many tiny parts may run differently from one carrying larger, mixed components. That gap matters.
Tips: Track good boards per hour during a representative production run. Record changeover time, feeder replenishment, and stoppages, not just the machine’s peak count.
Before choosing a machine, match its rated speed to your product mix and production plan. Ask for a practical demonstration using components similar to yours, then review the placement results and reject rate. Check whether operators can replenish feeders smoothly and recover from common interruptions. A very high headline figure is useful, but it can distract from the slower parts of the line. Even a well-configured machine cannot remove every bottleneck. Measure the complete process, and leave room for real-world variation.
Placement Precision: Panasonic NPM-W2S Specifies ±25 μm (Cpk ≥1)
A pick-and-place machine earns its place on a production line when it positions components consistently, not merely quickly. A stated placement precision of ±25 μm gives engineers a useful reference for fine-pitch parts and compact circuit layouts. That is roughly the width of a thin human hair. In practice, stable placement can reduce skewed components, solder bridges, and time spent correcting boards. Small errors matter.
The accompanying Cpk ≥1 figure describes process capability against defined tolerance limits; it is not a promise that every placement will land within ±25 μm in every factory. Feeder condition, nozzle wear, board support, component variation, and temperature can all affect results. Run a trial using your own boards and parts, then review placement data across multiple shifts. A machine may meet its specification in a controlled test yet need careful setup on your line. That gap is easy to underestimate.
Tips: Check calibration routinely, inspect nozzles, and record reject patterns by component location. Keep a few trial boards for comparison. Don’t trust one perfect run.
Business Fit: Compare CPH, Changeover Time, Feeder Capacity, and OEE
Why Choose a Pick and Place Machine for Your Business?
Business Fit: Compare CPH, Changeover Time, Feeder Capacity, and OEE
A machine’s advertised CPH is a starting point, not a production promise. Rated speed may assume simple boards, short travel paths, and uninterrupted feeding. Compare it with your actual mix: component sizes, placement accuracy, and daily board volume. Then ask for a trial using a representative job. A fast run on one easy board can mislead.
Changeover time affects every product switch. Track minutes from the last good board of one job to the first good board of the next. Check feeder capacity against your real component list; too few slots can mean extra loading and pauses. OEE combines availability, performance, and quality. The OEE Industry Standard reference guide cites 85% as a world-class benchmark, but treat it as context, not a universal target. Your baseline matters more.
Tips: Bring two contrasting board files to a supplier trial. Time the changeover, count feeder moves, and record good boards per hour. Small details matter. A spreadsheet can miss operator work and awkward reel handling, so leave room to revise your assumptions after a real shift.
Why Choose a Pick and Place Machine for Your Business?
Compare the capabilities that matter to your production mix. Scores are illustrative planning calculations, not measured market benchmarks: placement speed is scored against 10,000 CPH, changeover against a 15-minute target (lower is better), feeder capacity against 80 positions, and OEE against an 85% target. Validate requirements with your own products, line data, and operating conditions.
Investment Analysis: Measure Cost per Board Against Actual Machine Utilization
A pick-and-place machine should be judged by cost per good board, not headline placement speed. Add annualized purchase costs, financing, service, software, power, and operator time. Divide that total by accepted boards, excluding scrap and rework. Include feeder loading, changeovers, programming, and stoppages. Small batches change everything.
For example, $120,000 in annual ownership and operating costs equals $0.50 per board at 240,000 good boards. At 120,000 boards, the same cost becomes $1.00 each. These figures are illustrative, not a supplier quote. Track scheduled hours against productive run hours, and record changeover and downtime separately. That distinction matters. A line may appear busy while producing few saleable boards.
Deloitte and MAPI’s 2019 smart-factory survey reported roughly 10% higher output among participating manufacturers. It also reported about 12% higher labor productivity. These are reported gains, not guaranteed returns for a single machine. Compare them with your own shift logs and product mix. Include low-volume weeks, maintenance windows, and the time operators spend correcting setup errors. Those costs are easy to miss, and the estimate may still need revision after a production trial.

 24 Hour Service