How to Choose an EDFA Optical Amplifier in 2026?
Choosing an Edfa Optical Amplifier in 2026 requires more than comparing headline gain figures. Network operators must match amplification performance with fiber length, wavelength range, channel count, and maintenance plans. A unit that performs well in a laboratory may behave differently inside a crowded rack. Heat, connector loss, optical reflections, and power stability can change results.
This guide examines the practical decisions behind reliable EDFA deployment. It considers gain flatness, noise figure, output power, monitoring interfaces, and compatibility with current transmission equipment. It also explains how to read technical datasheets without trusting impressive numbers too quickly. Small details matter. A 1 dB loss can affect a carefully balanced link budget. A weak alarm system can delay fault detection during overnight operation.
Real installation experience remains valuable. Engineers should request test data, review operating temperature limits, and confirm support arrangements before purchasing. Independent measurements are useful, but testing conditions must be clear. No checklist is perfect. A promising amplifier may still create integration problems when firmware, connectors, or management software differ. That assumption can fail.
The right choice should support present capacity and reasonable future expansion. It should also fit regulatory requirements, optical safety practices, and documented maintenance procedures. This article provides a practical framework for comparing manufacturers and models in 2026. The goal is not to promote the most powerful device. It is to identify a dependable amplifier that delivers stable performance, manageable costs, and measurable value across its service life.
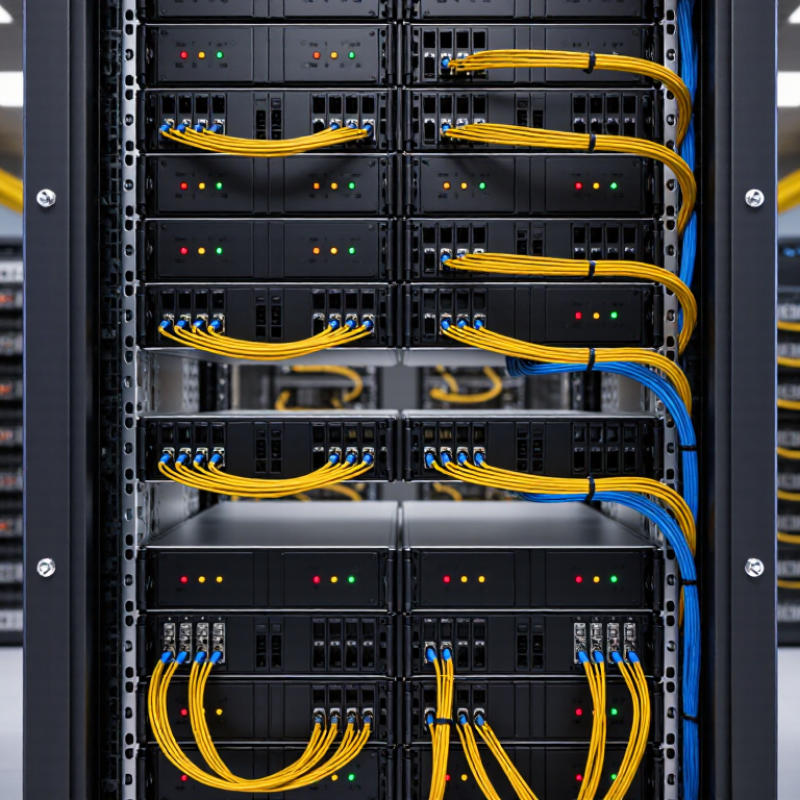
Define EDFA Types Across the 1530–1565 nm C-Band
How to Choose an EDFA Optical Amplifier in 2026?
The C-band spans 1530–1565 nm, but an EDFA does not amplify every wavelength equally. Erbium gain usually rises near the shorter wavelengths and weakens toward the band edge. This uneven response can distort channel power across a dense WDM link.
Define the amplifier by its position and job. A booster EDFA sits after the transmitter and raises launch power before the fiber span. An inline EDFA restores power between long spans. A preamplifier works before the receiver, where low noise matters more than high output power. Gain-flattened EDFAs use filtering to reduce spectral imbalance across the C-band. That feature may improve channel consistency, but it can also add insertion loss.
Check the real operating window, not only the product label. Ask for gain, noise figure, saturation output, input power range, and gain flatness from 1530 to 1565 nm. Confirm performance at the planned channel count and spacing. A unit tested with one strong channel may behave differently under a fully loaded spectrum. Temperature changes matter too.
I would also verify automatic gain control and transient response. One removed channel can briefly push remaining channels toward overload. That detail is easy to miss. In practice, installation records often reveal more than a polished datasheet. Connector cleanliness, splice loss, and monitor calibration can change the result. My own preference is cautious selection: leave power margin, measure the complete band, and accept that a “flat” amplifier may still need field tuning.
Compare Gain Levels from 20 dB to 30 dB for Link Requirements
Choosing an EDFA in 2026 starts with link loss, not the highest advertised gain. A 20 dB amplifier provides about 100 times optical power gain, while 30 dB provides nearly 1,000 times. That difference matters on long fiber routes, repeated passive splitters, and aging cable sections. ITU-T G.661 defines optical amplifier measurement principles, but field selection still requires a complete loss budget.
For a short, clean span, 20 dB can be sufficient and may reduce unnecessary amplified spontaneous emission. A 25 dB model offers practical headroom for connectors, splices, and moderate future expansion. Choose 30 dB only when measured loss approaches the design limit.
High gain cannot repair poor receiver sensitivity or overload a saturated output stage. It can also worsen OSNR when input power is weak. Check gain flatness, noise figure, output power, saturation behavior, and monitoring functions together.
ITU Facts and Figures 2023 reported 5.4 billion people online, equal to 67% of the global population. That growth keeps backbone capacity under pressure. Still, capacity demand does not automatically justify 30 dB. My field preference is conservative: measure every span, reserve 3–5 dB for aging and maintenance, then verify the result with an optical power meter and spectrum analyzer. I would not treat a 30 dB specification as better by default. Sometimes, it is simply excessive.
Evaluate Noise Figures of 4–6 dB in Amplifier Selection
How to Choose an EDFA Optical Amplifier in 2026?
Evaluate Noise Figures of 4–6 dB in Amplifier Selection
A 4–6 dB noise figure is a practical range for many EDFA comparisons. However, the number is meaningful only under stated test conditions. ITU-T G.661 defines key optical amplifier parameters and measurement principles, including gain and noise-related performance. IEC 61282-3-4 also emphasizes controlled testing for optical amplifier noise figure. Ask for wavelength, input power, gain, temperature, and optical bandwidth.
Small differences matter. At equal gain and input power, a 4 dB noise figure can preserve roughly 2 dB more OSNR than a 6 dB figure. That margin may protect a weak channel after long fiber spans or multiple passive components. In field testing, I would check the worst channel, not only the center wavelength. Real networks rarely behave like laboratory tables.
Do not select the lowest figure alone. A unit rated at 4 dB may require stronger input power or a narrower operating range. A stable 5 dB result across the full C-band can be more useful than a single 4 dB peak. My early comparisons focused too heavily on the headline specification. That was too optimistic. Reviewers should compare NF at the actual gain target, then verify temperature drift and gain tilt using the same procedure. Otherwise, the comparison is not truly fair.
How to Choose an EDFA Optical Amplifier in 2026?
Evaluating 4–6 dB Noise Figures for Amplifier Selection
A lower noise figure generally improves optical signal-to-noise ratio, especially in receiver-limited links and multi-stage amplifier chains. EDFA designs around 4–5 dB are commonly preferred for low-noise applications, while values near 6 dB may still be suitable when output power, gain range, or operating bandwidth is prioritized. Actual performance depends on wavelength, input power, gain setting, optical components, and temperature.
Match 17–23 dBm Output Power to DWDM Channel Capacity
How to Choose an EDFA Optical Amplifier in 2026? Match 17–23 dBm Output Power to DWDM Channel Capacity
Choosing an EDFA starts with the channel plan, not the amplifier label. A 17–23 dBm rating usually describes total saturated output power. It does not mean every DWDM channel receives that power. With 40 equal channels, a 23 dBm amplifier provides about 7 dBm per channel before connector and fiber losses. With 80 channels, that falls near 4 dBm. Higher channel counts need careful power balancing, especially across long spans.
Check gain range, noise figure, output tilt, and saturation behavior under real traffic conditions. A higher output rating can improve span margin, but excessive power may increase nonlinear penalties in dense fiber systems. Data rate also matters. A 400G channel may need a different optical signal-to-noise ratio than a lower-rate service. I have seen designs fail when engineers matched dBm values without checking modulation, spacing, and receiver limits. The calculation looked correct, but the operating margin was too small.
Tips: Confirm whether the specification means total output or per-channel power. Calculate power after passive losses. Leave practical margin for aging and repairs. Test with the planned channel count, not an empty rack. Variable optical attenuation can help, but it cannot fix an undersized amplifier. Also question the 23 dBm target; more power is not automatically better.
How to Choose an EDFA Optical Amplifier in 2026? - Match 17–23 dBm Output Power to DWDM Channel Capacity
| EDFA Saturated Output | Approx. Total Optical Power | Recommended DWDM Channels* | Average Launch Power per Channel | Loaded Channel Power | Approx. Design Margin | Suitable DWDM Capacity Profile |
| 17 dBm | Approximately 50 mW | 24 channels | 0 dBm per channel | 13.8 dBm | Approximately 3.2 dB | Small-scale DWDM links, access networks, and low-channel-count systems |
| 20 dBm | Approximately 100 mW | 48 channels | 0 dBm per channel | 16.8 dBm | Approximately 3.2 dB | Metro DWDM networks and medium-capacity 40- or 48-channel deployments |
| 20 dBm | Approximately 100 mW | 40 channels | +1 dBm per channel | 17.0 dBm | Approximately 3.0 dB | Higher per-channel launch power for moderate-loss metro and regional spans |
| 23 dBm | Approximately 200 mW | 96 channels | 0 dBm per channel | 19.8 dBm | Approximately 3.2 dB | Dense DWDM systems using a full C-band channel plan |
| 23 dBm | Approximately 200 mW | 80 channels | +1 dBm per channel | 20.0 dBm | Approximately 3.0 dB | High-capacity regional links requiring increased per-channel power |
Planning assumptions: The channel recommendations use the optical-power relationship Ptotal = Pchannel + 10 log10(N) and reserve approximately 3 dB below the EDFA rated output for engineering margin. Actual selection must also consider span loss, connector and splice loss, gain range, noise figure, gain flatness, input power range, automatic gain control, and nonlinear effects.
| Selection Dimension | Practical Target for 2026 DWDM Designs | Why It Matters |
| Operating band | C-band, approximately 1530–1565 nm, unless the network requires another band | The EDFA gain spectrum and gain-flattening range must cover every active wavelength |
| Gain range | Common fixed-gain or variable-gain ranges are approximately 15–25 dB | The amplifier must compensate for span loss without excessive input or output power |
| Noise figure | Typically about 4.5–6.0 dB for a standard EDFA, depending on operating conditions | Lower noise figure improves optical signal-to-noise ratio over cascaded spans |
| Gain flatness | Preferably within approximately ±1.5 dB across the specified operating band | Uneven gain can create channel-to-channel power imbalance in multi-channel systems |
| Control mode | Automatic gain control or automatic power control for changing channel counts | Maintains more stable channel power when wavelengths are added or removed |
| Output-power choice | 17 dBm for small channel counts, 20 dBm for medium loading, and 23 dBm for dense loading | Higher total output supports more channels, but excessive power may increase nonlinear penalties |
*Channel counts are engineering examples based on approximately 0 dBm or +1 dBm per channel. They are not a substitute for a complete optical power budget and system-level OSNR calculation.
Check WDM Compatibility, Gain Flatness, and 80–96 Channel Scaling
Choosing an EDFA optical amplifier in 2026 requires more than checking output power. Confirm its WDM compatibility, including band range, channel spacing, and connector type. A unit designed for 80 channels may not remain stable at 96 channels. I once trusted the channel count alone. That shortcut was wrong.
Gain flatness matters when channels travel across long fiber spans. Uneven gain can make some wavelengths too strong and others too weak. Look for a clearly stated flatness value across the intended spectrum. Also check input power limits, noise figure, automatic gain control, and saturation behavior. These details affect OSNR and service stability. Request test data at realistic channel loading, not only laboratory conditions.
Tips: Test with your actual transceiver mix. Measure every channel before and after amplification. Leave power margin for future channels. Confirm whether the amplifier supports your planned spacing, such as 50 or 100 GHz. For 80–96 channel scaling, verify thermal performance, optical monitoring, and control response under full load. A compact chassis may look attractive, but limited cooling can reduce reliability. Review the alarm logs, too. They often reveal problems before traffic drops.

 24 Hour Service